Institutional Insights: Goldman Sachs March Flow of Funds Update


Month-end typically signals a market recalibration as it processes critical flows. In true 2026 fashion, investors are already grappling with uncertainty and volatility as March begins. With the S&P struggling to break through the critical 7,000 "gamma wall," investor sentiment and positioning suggest the market's direction is likely downward. Despite a supportive macroeconomic backdrop, persistent walls of worry continue to make the road ahead challenging. We’ll monitor changes in flow dynamics, but the coming weeks are expected to remain tough for U.S. equities. Below is a detailed analysis, including our top trade ideas, such as NDX/SPX dispersion strategies and a renewed focus on consumer discretionary stocks.
Key Trades:
- Short-term tactical hedge: USD 31Mar26 .SPX<95% & 10ySOFR<ATMF CMS-0.15% @ 6.3%
- Medium-term fundamental hedge: USD 18Jun26 .SPX<95% & 10ySOFR<ATMF CMS-0.15% @ 10%
1. Geopolitical Implications:
While we defer to experts on geopolitical specifics, we analyze the impact of oil price spikes on S&P performance. Historically, the outcomes are mixed. Excluding extreme cases, median returns beyond the short-term are generally positive, with Brent crude showing similar patterns.
Notable historical data since 2000 (22 instances of WTI crude spiking by 10%+ in a single day):
- 1 Day: Avg. -0.24% (Median: -0.01%)
- 1 Week: Avg. +0.52% (Median: +1.30%)
- 2 Weeks: Avg. -0.35% (Median: +1.75%)
- 1 Month: Avg. +1.23% (Median: +3.57%)
GS experts, led by Dom Wilson, highlight that while oil price spikes negatively affect equities and credit, only prolonged and severe disruptions would significantly impact global growth. Cyclical sectors and oil-importing markets remain vulnerable, particularly given their strong start to the year. These areas could face pressure unless a swift resolution is achieved.
2. Prime Brokerage (PB) Update: The Buyer’s Strike Persists
Global equities witnessed net selling for the second consecutive week (-0.6 standard deviations on a 1-year basis). Gross trading activity rose, driven by short sales outpacing long buys at a ratio of 2.1:1. This increase in gross exposure, combined with ongoing dispersion beneath the surface, is expected to fuel further de-grossing episodes and factor rotations, trends that have defined the year so far.
Year-to-date, our PB team has identified key sector themes:
- Semiconductors: Net buying
- Software: Net selling
- Private credit-fueled financials: Net selling
These trends suggest that further sector rotations could emerge as a prominent "pain trade" in the near term.
Elsewhere, emerging markets (EM) were the most heavily net bought region this week, driven by long positions. Year-to-date, EM ranks as the second-most net bought region, following developed markets in Asia. In contrast, North America and Europe have both experienced net selling this year.
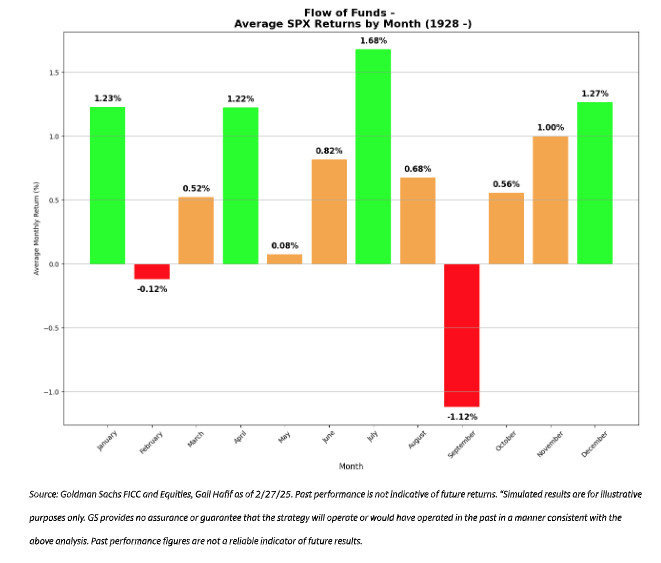
Seasonality
Historically, March tends to be a wetter and more volatile month for the S&P. The first half of the month typically experiences choppy, downward price action, but on average delivers a modest return of 30 basis points (bps) from March 1 to March 14. Interestingly, the trend shifts on March 14, with the following two weeks (starting March 15) yielding an average return of 80 bps. Despite this mid-month recovery, March ranks as the fourth-worst month for S&P returns since 1928. However, it is often followed by a significantly stronger performance in April.
Buybacks
Buybacks remain robust, with last week’s activity reaching 1.7 times the 2025 year-to-date (YTD) average daily trading volume (ADTV) and 1.5 times the 2024 YTD ADTV. While buybacks continue to provide a supportive tailwind for U.S. equities into mid-March, their eventual tapering could amplify existing market volatility. We anticipate the next buyback blackout window to begin around March 16 and extend through the end of April. In terms of authorizations, 2026 YTD buyback authorizations stand at $317 billion, making it the second most active year on record, just behind 2023 YTD’s $318 billion.
CTAs
The systematic community currently takes a backseat in the US equity market but is expected to play a more prominent role in the oil market as geopolitical tensions continue to drive price fluctuations.
As always, sustained trends in equity markets will influence systematic behavior. So far this year, CTAs have sold nearly $13 billion in US equities. However, our model indicates they are gradually shifting to buying—though this could change rapidly depending on market conditions.
Key levels to monitor:
In a significant downturn, CTAs could sell up to $26 billion.
Short-term level: 6,906
Medium-term level: 6,752
Long-term level: 6,341
Disclaimer: The material provided is for information purposes only and should not be considered as investment advice. The views, information, or opinions expressed in the text belong solely to the author, and not to the author’s employer, organization, committee or other group or individual or company.
Past performance is not indicative of future results.
High Risk Warning: CFDs are complex instruments and come with a high risk of losing money rapidly due to leverage. 71% and 74% of retail investor accounts lose money when trading CFDs with Tickmill UK Ltd and Tickmill Europe Ltd respectively. You should consider whether you understand how CFDs work and whether you can afford to take the high risk of losing your money.
Futures and Options: Trading futures and options on margin carries a high degree of risk and may result in losses exceeding your initial investment. These products are not suitable for all investors. Ensure you fully understand the risks and take appropriate care to manage your risk.
Patrick has been involved in the financial markets for well over a decade as a self-educated professional trader and money manager. Flitting between the roles of market commentator, analyst and mentor, Patrick has improved the technical skills and psychological stance of literally hundreds of traders – coaching them to become savvy market operators!