Institutional Insights: BofA "Extreme Outflows Week'

EQUITY FLOWS & CLIENT POSITIONING BRIEFING: BofA EQUITY CLIENT FLOW TRENDS
THE TAKE: RECORD SINGLE-STOCK OUTFLOWS DRIVEN BY HISTORIC MUTUAL FUND TAX-LOSS SELLING
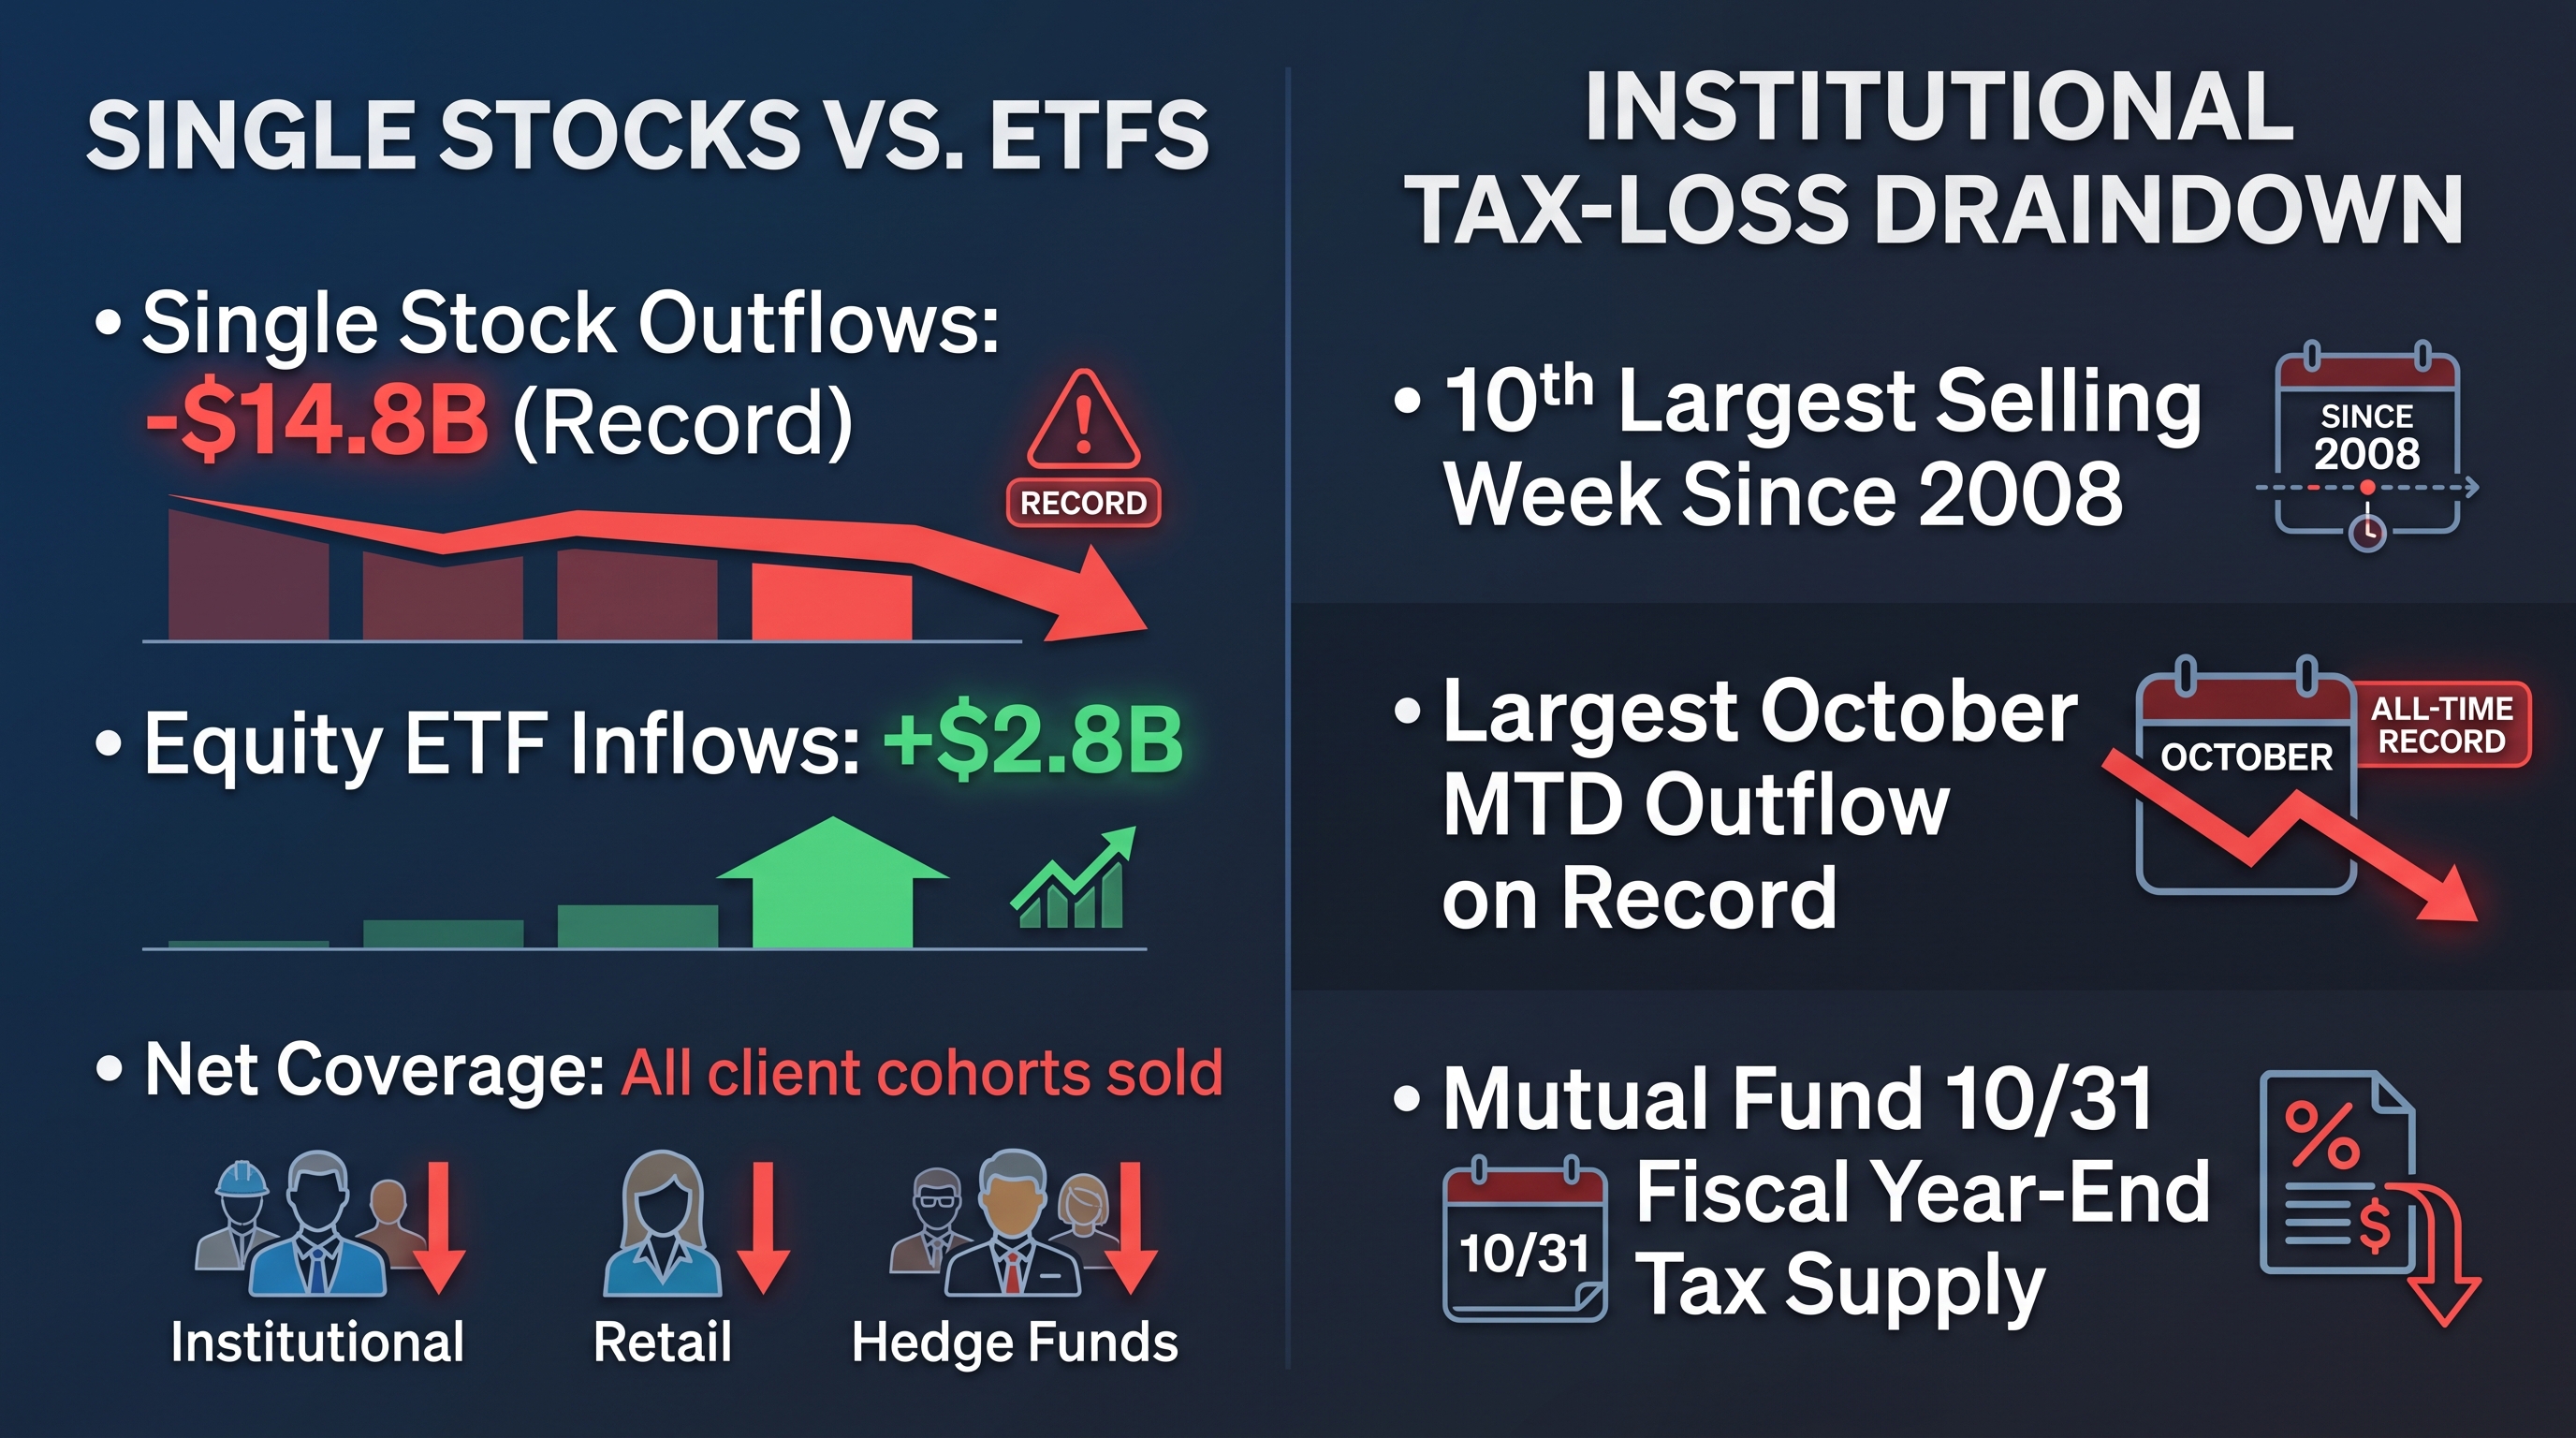
Bank of America Securities equity client flows revealed extreme institutional risk-off activity, headlined by a record -$14.8 billion in single-stock net outflows as the S&P 500 fell -1.9% on the week. While clients bought $2.8 billion in equity ETFs, net equity flows were heavily negative across all major client coverage cohorts (Institutional, Retail, and Hedge Funds).
The selling was spearheaded by institutional clients recording their 10th largest weekly net selling session since 2008. BofA equity strategists note that October is seasonally the heaviest selling month for institutional accounts due to active mutual fund tax-loss harvesting ahead of the October 31 fiscal year-end deadline. Normalized by S&P 500 market capitalization, month-to-date institutional outflows stand as the largest October institutional drain on record.
CLIENT COHORT BREAKDOWN & CORPORATE BUYBACKS
Institutional Clients: Led overall market selling (3rd consecutive week of net supply), driven by historic mutual fund tax-loss harvesting. Outflows as a percentage of S&P 500 market cap exceed all prior October reporting periods back to 2008.
Retail Clients: Turned net sellers of US equities after 2 consecutive weeks of net buying.
Hedge Funds: Net sold equities for the first time in 5 weeks.
Corporate Buyback Execution: Corporate client repurchase activity accelerated for a 3rd consecutive week, though execution rates remain slightly below historical seasonal averages. Annualized YTD buybacks are tracking below 2024–2025 levels, with rolling 52-week buybacks as a percentage of S&P 500 market cap dropping to their lowest level since August 2021.
SECTOR FLOW EXTREMES & RECORD OUTFLOWS
Clients sold single stocks in 8 of 11 S&P 500 sectors, with liquidations heavily concentrated in Technology and Industrials:
Information Technology (2nd Largest Outflow Ever): Single-stock Technology experienced its 2nd largest dollar net outflow on record (15th largest when normalized by Tech market cap). Technology ETFs were similarly the most net-sold sector wrapper.
Industrials (Largest Outflow Ever): Industrials logged its 12th consecutive week of net outflows, marking the largest single-week dollar outflow in BofA dataset history (3rd largest as a % of Industrials market cap). Trailing 12-week Industrial outflows as a percentage of market cap have hit an all-time high.
Sector Inflow Leaders: Energy recorded the largest net inflows (marking its first net positive flow week in 6 weeks). Real Estate and Consumer Staples single stocks also registered net client buying.
ETF FLOW STYLE & SIZE BREAKDOWN
Style & Size Coverage: Equity ETF buying was broad-based across all style buckets (Value, Blend, and Growth) and all market cap segments (Large-Cap, Mid-Cap, Small-Cap, and Broad Market ETFs).
Sector ETF Disparity: Clients sold ETFs in 8 of 11 sectors. Consistent with single-stock trends, Tech ETFs led all sector outflows, while Health Care ETFs captured the largest net inflows.
Source Document: BofA Securities Equity Client Flow Trends
Publication Window: Mid-October 2026 (Data covering trailing week ending mid-October 2026
Disclaimer: The material provided is for information purposes only and should not be considered as investment advice. The views, information, or opinions expressed in the text belong solely to the author, and not to the author’s employer, organization, committee or other group or individual or company.
Past performance is not indicative of future results.
High Risk Warning: CFDs are complex instruments and come with a high risk of losing money rapidly due to leverage. 68% and 74% of retail investor accounts lose money when trading CFDs with Tickmill UK Ltd and Tickmill Europe Ltd respectively. You should consider whether you understand how CFDs work and whether you can afford to take the high risk of losing your money.
Futures and Options: Trading futures and options on margin carries a high degree of risk and may result in losses exceeding your initial investment. These products are not suitable for all investors. Ensure you fully understand the risks and take appropriate care to manage your risk.
Patrick has been involved in the financial markets for well over a decade as a self-educated professional trader and money manager. Flitting between the roles of market commentator, analyst and mentor, Patrick has improved the technical skills and psychological stance of literally hundreds of traders – coaching them to become savvy market operators!